2-Deoxyglucose (2-DG) Uptake and Autoradiographing
Animals were injected into the tail vein with 2-DG (200 uCi/kg) in saline and exposed to odors in a glass chamber
connected to the output of a flow dilution olfactometer. After 45 minutes the animals were sacrificed and the brains
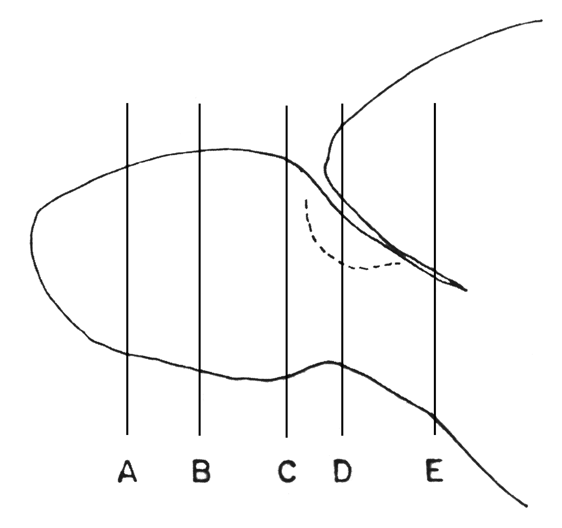
were removed and processed for cryostat sectioning using routine procedures. Serial coronal sections of the olfactory bulb (Figure 1, left graph, A to E)
were picked up on coverslips and exposed to Kodak X-ray film.
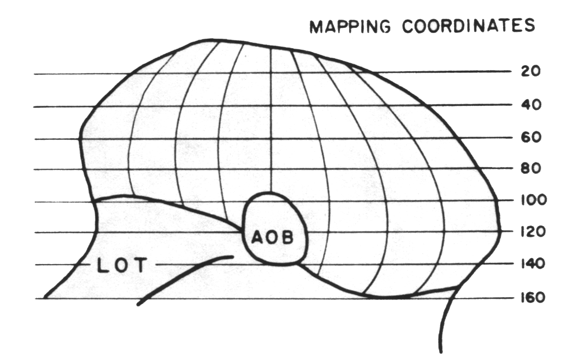
The autoradiographs of 2-DG uptake were measured. The focal densities on each section were localized according to
their position around the circumference of the bulb glomerular layer in the coronal plane and along the rostral-caudal axis.
The positions of the densities within these coordinates were plotted in two-dimensional maps (Figure 1, rigth graph). In this original procedure the odor maps were dorsal centered in order to preserve the continuity of the dorsal surface and its relation to the accessory olfactory bulb and lateral olfactory tract. For similar procedures used in other studies, see 2-DG (Leon Laboratory) and c-fos (Restrepo Laboratory).
|
Functional Magnetic Resonance Imaging (fMRI)
Animals were anesthetized with 1–2% halothane and removed of the skin overlying
the OB to expose the skull. After surgery, the anesthesia was switched to urethane (i.p. 1.5 g/kg initial; 0.1 g/kg/h
supplemental) and the animal was placed into the magnet. The head was secured in a holder to minimize movement and the
body temperature was maintained by a water-heated blanket. The animal was exposed to odorized airflow that was generated
with an odor delivery system.
MRI experiments were performed on a horizontal-bore 7T Bruker spectrometer
(Bruker, Billerica, MA). A circular radio-frequency transmit-receive surface coil probe (10-mm diameter) was centered
on top of the skull above the OB. All image orientations were coronal. Contiguous slices were obtained to cover the
entire OB in an anterior-posterior fashion. A set of T1-weighted fast low-angle single-shot (FLASH) images were obtained
(in-plane resolution = 100×100 µm; slice thickness = 200 µm; repetition delay = 5.0 s; echo time = 16 ms;
flip angle = 90º). These images showed the laminar structures of the OB, so-called anatomical MRI images.
Multiple fMRI experiments, each consisting of a series of T*2-weighted FLASH images (in-plane resolution = 200×200 µm;
slice thickness = 200 µm; repetition delay = 400 ms; echo time = 16 ms; flip angle = 5-15º), could be carried out on
the same animals. The animals were rested at least 20 min between successive experiments to avoid adaptation.
For each experiment, the mean image of the pre-stimulation images (S) was subtracted from the stimulation images (ΔS+S)
on a pixel-by-pixel basis to produce either ΔS/S maps or Student’s t maps. Usually, 2–4 functional maps were averaged to
give a single functional map, so-called an fMRI image.
The fMRI signals in the rodent olfactory bulb were detected when the animals
were exposed to odor stimuli and, therefore, they reflected odor-induced neural activities in this unique brain region.
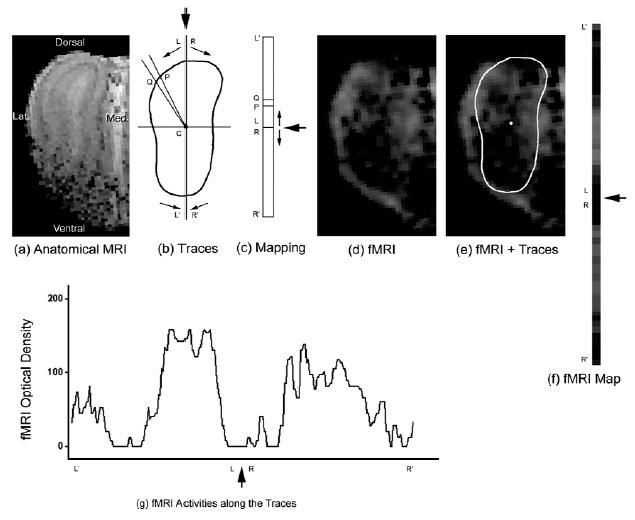
Odor maps described the spatial activity patterns in the glomerular layer of the entire OB in response to a given odor
stimulation. The fMRI odor maps were generated with a software program, called OdorMapBuilder. The program allowed users
to locate and trace the glomerular layer on the anatomical MRI images (Figure 2a,b). The traces were then spread out and
a corresponding band was plotted on the map image (Figure 2b,c). Data from adjacent slices were also plotted accordingly.
From a set of serial images, a two-dimensional flat map could be generated in which its color-coded signals represented
the MRI readings from the entire glomerular layer. Since all images were obtained from the same animal in a fixed position,
the traces from the anatomical MRI images were applied to all corresponding fMRI images (Figure 2d,e). The fMRI signals
along the traces were used to plot the band in the fMRI odor maps (Figure 2e–g), thereby producing the fMRI odor maps.
|